[vc_row][vc_column][vc_column_text]An informative blog requires that you narrate your point with clarity. While clarity comes from your style of writing, the acceptance of your ideas will come only from solid facts that support it. So, in blogging relevant data is an essential parameter for authenticity. The role of statistical data analysis in ascertaining authenticity is a known fact. But the trouble is to make it easily understandable. Most of us tend to turn away from large columns of comparisons that are laid raw in front of us. So the need is for something more simpler.
Data visualisation plugins can go a long way in simplifying large data and make them presentable for all types of audiences. WordPress is an ideal platform for beginners and experts alike, has some remarkable data visualization tools that give real power to your ideas and adds value to your content.
WordPress is all set to be the future platform for growing businesses. Its ability to impress viewers with infographics and facile content management makes it an ideal tool for any aspiring business. Here are the top 10 plugins that you shouldn’t miss while beautifying data for your WordPress site:
Visualizer: Tables and Charts Manager for WordPress (Lite)
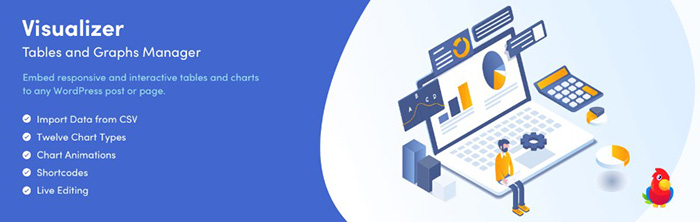
Visualizer plugin is provided free of cost by WordPress. It is comprehensive and lets design, embed and manage charts that are interactive and dynamic. It easily facilitates Excel to WordPress using the chart builder for WordPress.
Key Features:
- Enables use of Google Chart Tools with customizing
- HTML5/SVG provides cross-platform portability
- 11 flexible chart types are available
- Auto synchronize and edit option for users
Data Tables Generator

This Suspsystic developed plugin it lets you manage visualizations and analytics even if you have no prior experience in data management. It is a free plugin that can add to your data analytics experience in WordPress.
Key Features:
- Unlimited size of tables
- Frontend table editing
- Imports from Google Docs automatically
Inline Google Spreadsheet Viewer

WordPress and Google Spreadsheet always had difficulty to relate with each other. Inline Google Spreadsheet is the solution that Meitar Moscovitz had to offer. It now makes the integration easy. You can merely embed live previews of many formats like PDF, XLS, DOC and other forms provided by Google Docs Viewer.
Key Features:
- Instant updating of Google Spreadsheet or CSV file
- Quick chart building from Google Spreadsheet CSV file, MySQL database
- Allows embedding an online document from within the blog
Snowball

It is maintained and developed by open HTML team. It opens up a new avenue for creative writers to express themselves, hence making it unique in its appeal. The content blocks in Snowball gives a magazine feel to the articles. Being open source, it has a large number of subscribers.
Key Features:
- Modify CSS and HTML using code editor as per need
- YouTube, Vimeo, Google Maps, SoundCloud media modules are available
- Scatterplot, bar graph, and choropleth data modules
- Meta modules include contact forms, share buttons, and a table of contents.
Responsive Charts

It is a premium plugin and is very useful in adding HTML5 based charts with animation. The charts in this plugin can be set in such a way that it has a responsive width. Thus your chart is auto customized to fit into any device screen. A range of customizing options make it an important tool in WordPress.
Key Features:
- Multiple charts per page
- Helps import Data sets of CSV
- Charts and tooltips that are customizable
- Highly responsive
M Chart

A data visualization tool that lets you display your carts with clarity. Once you prepare the co can use the shortcode to insert the chart into the post. M Chart is free a free plugin developed by Jamie Potra.
Key Features:
- A lightweight plugin
- Allows to manage data sets through a spreadsheet interface
- Chart.js or Highcharts chart libraries to present the data in the chart
- Shortcode support is available
Infogram

It is one of the recent tools that rose to popularity. It helps to import data from CSV, XLS, XLSX. It is popular with bloggers, newsrooms and journalists for its interactive designs. Infogram gives richness to your pages with interactive reports, maps, and infographics. The drag-and-drop editor is another remarkable feature.
Key Features:
- High-quality template designs
- Fast, smooth and balanced with pre-set colors
- Enables embedding of any publicly available chart or infographic
- One-click embedding from the library
wpDataTables Lite

It is a premium plugin that comes with a comprehensive solution for visual data management. Be it Google, Excel Spreadsheet or MySQL data wpData Tables provides an intuitive framework for you.
Key Features:
- Allows administrator edits from the front-end page
- Back-end visual data management
- Secures data
TablePress

It is the leading table creator for WordPress particularly for projects which have a large data-set. It helps to display tables with the help of shortcode. Using TablePress, you can manage data directly from admin’s dashboard.
Key Features:
- Permits customizing content viz. text, visuals, numbers, HTML, JavaScript etc.
- Enables Excel formula modifications
- Permits highlighting for individual rows
- Import facility from both traditional and external servers
Blazing Charts

It is very elementary and simple to use the tool. It lets you make the most of the charting libraries that already exist, provided it has a GPL license. It allows you to create chart code snippets, that can be included in your posts using the shortcode of “BlazingChart”.
Key Features:
- Lets you add interactive maps and charts
- Very simple to use
- Supports multiple charting libraries like ZingChart, Chart.js, Google Charts, Smoothie Charts, Flot Charts, D3.js, Morris.js, Chartist.js.
Final Words
The print media is slowly fading, and online blogs are growing in number and fame. The future of writing is definitely in the digital world, as it is much simpler to propagate and is eco-friendly. Today, creating a mobile app is very easy. The advancement in mobile technology has made smartphones an efficient digital medium. While WordPress continues to be the most popular blogging platform, the plugins add more color to it. Data visualization with the above plugins make life much simpler for non-technical writers and beginners. The proficient and experienced writers can add value to their articles with these plugins. So next time you are blogging, check out these plugins.[/vc_column_text][/vc_column][/vc_row]