Page Speed Metrics: The Basics
But before you can go ahead and start using those tools, there are a few key metrics related to website speed that you need to be aware of. These include:
- Time to First Byte: This measures the period of time that passes between when a user (or client) first makes a request to a page, to the time when the first byte is being received by that browser.
- Time to Interactive: This metric measures the amount of time between when a page begins to load and a user is actually able to interact with it.
- First Paint: This metric refers to the amount of time it takes for a browser to display web page content onto someone’s screen.
- First Contentful Paint: This metric measures the amount of time that takes place between the time when navigation becomes available to the time when someone’s browser displays the first bit of content.
- First Meaningful Paint: This measures the amount of time it takes not just for your page to appear, but for its primary content to become available to the user.
For the absolute best results, all of these numbers need to be as low as humanly possible. People WILL NOT give you the benefit of the doubt on this one.
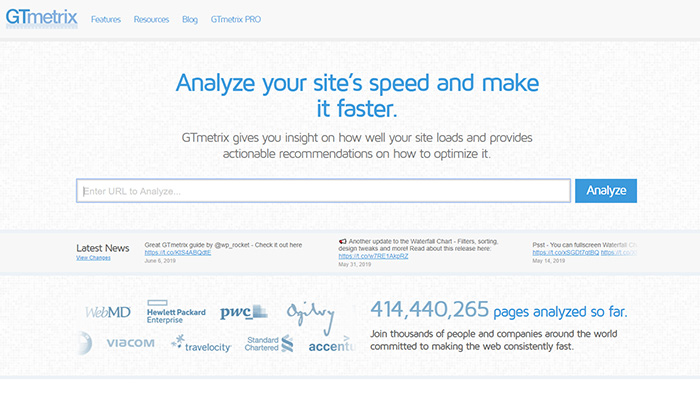
GTmetrix
Pingdom
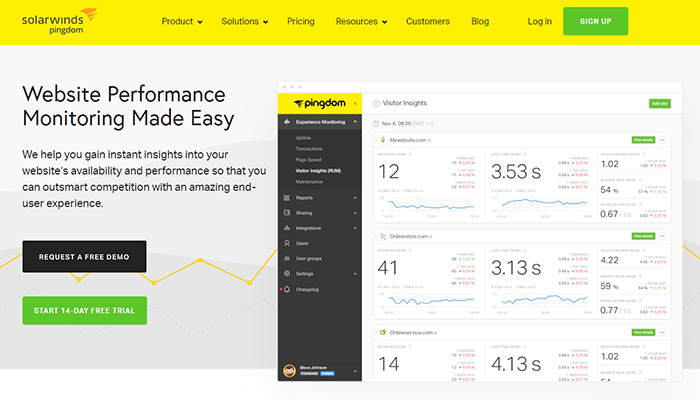
The Pingdom Website Speed Test is the perfect opportunity for finding any bottlenecks that may exist with your WordPress site as quickly as you can. It’s filled with valuable insight including which elements of your site are fast along with which are slowing things down. If there’s one particular asset that is too big that is playing havoc with the rest of your page, rest assured that Pingdom will be able to tell you about it in a way that is easy for both experts and novices to use.
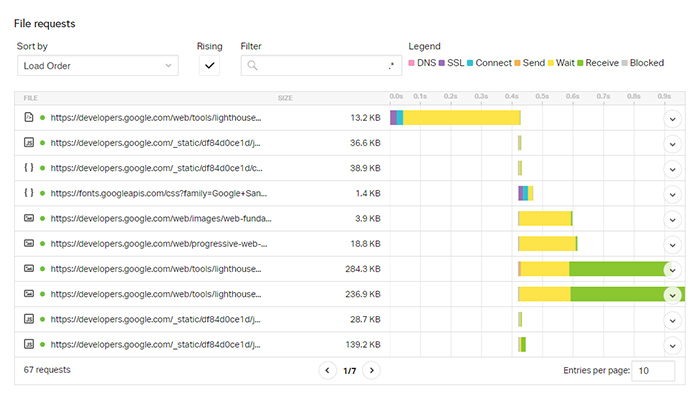
One of the great features that Pingdom has, is its Waterfall chart. It basically breaks down your page rendering from the time, the browser is connected to the server, to the last byte that browser receives. Pingdom creates a colorful breakdown of all the requests, and by hovering over each request you can see the time that it took to connect to the origin server, and the time it took for the browser to show that to the user. This will help you diagnose any issues that you might have with your web server, CDN, or hosting, and help you find ways to improve the page load.
WebPageTest
Google's Page Speed Insights
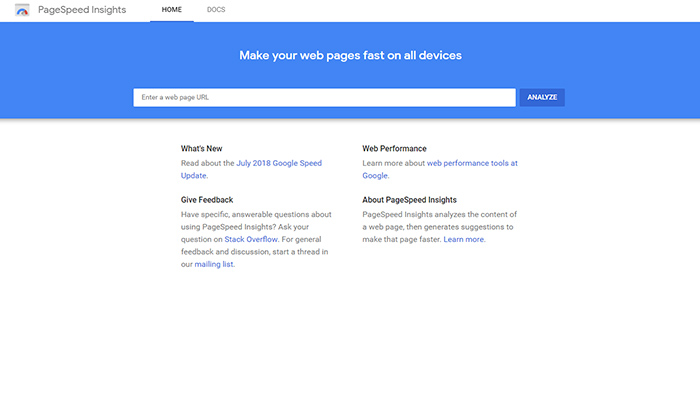
Google’s Page Speed Insights tool is a great way to make sure that your WordPress site loads as quickly as possible on ALL potential devices someone might be using. Just because the desktop experience you offer is a great one doesn’t mean that the same is true on mobile. This is the perfect tool to use to make sure EVERYONE can enjoy that lightning fast speed you’re trying to offer, no matter what.
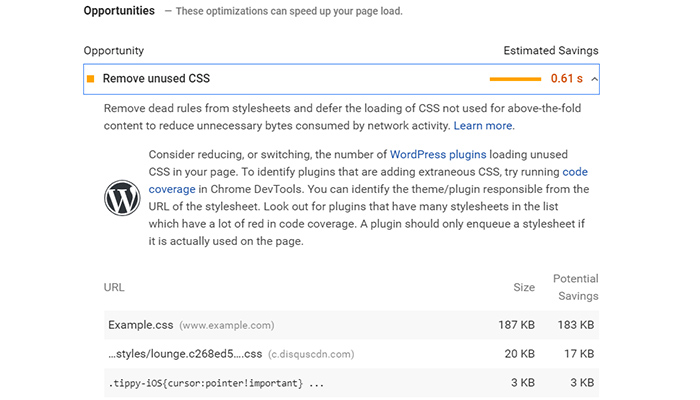
Google recently announced that website performance has indeed a direct effect on your search engine ranking. Using this tool allows you to check how speedy Google finds your website! It also gives you suggestion, based on plugins and techniques you can use to fix each issue.
Lighthouse
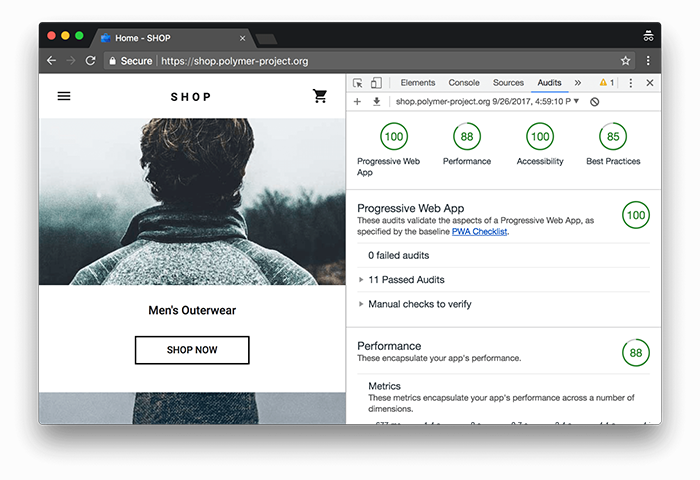
Lighthouse is great because it’s a tool that is not only open source but also automated. During audits, the tool will run a number of tests against your page before presenting you with a speed report. From that perspective, it’s a great way to not only improve the speed of your page today but to also automatically prevent it from getting slow again down the road.
Lighthouse is very similar to the Google Page Speed insights tool. They both, in fact, use the same API. The advantage that Lighthouse has over all the other tools mentioned until here, is its flexibility. You can run Lighthouse in your Chrome DevTools (we’ll be discussed shortly), from the command line, or as a Node module. Though, it’s a bit more advanced, it will give you all the the data you need to speed up your website. It also includes handy SEO, accessibility and progressive web apps audit.
So if you ever found yourself wishing for a tool that allows you bulk check a lot of pages, or set a performance budget for your pages, lighthouse is the right tool for you.
Google Chrome DevTools
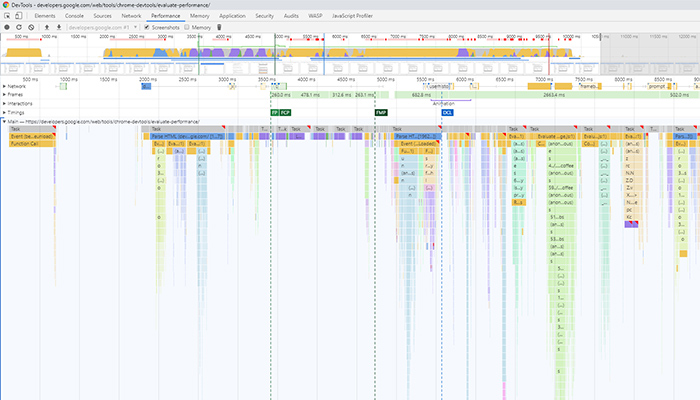
Finally, we have Google Chrome DevTools – a solution that is particularly useful because it’s built right into the Google Chrome Web browser. So not only can you diagnose speed issues quickly, but you can also edit pages just as fast – thus allowing you to improve the speed of your WordPress site in a matter of minutes whenever problems occasionally arise. Google also has built Lighthouse into the DevTools, so you can easily run an analyze your page from the “Audit” tab in your dev console.
Bonus! Request Map Generator:
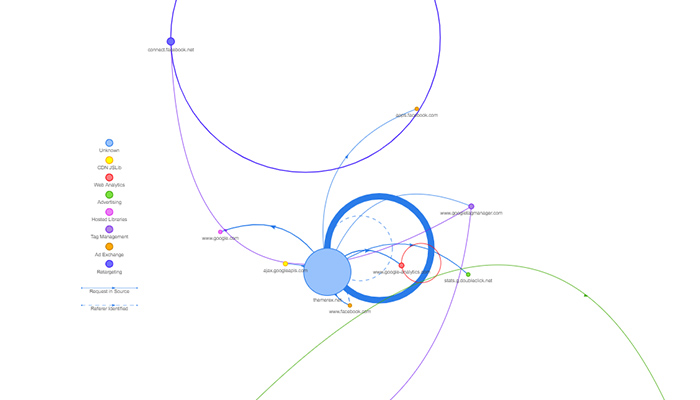
A lot of times, one of the main reasons that a WordPress Website starts to slow down, is due to the number of requests that your website is making. This might be an easy thing to fix, but diagnosing this issue is very tricky and difficult, as you have to check each request one by one, and see what that’s exactly for. The Request Map Generator, is a very handy tool that creates a very cool map of all your requests. Depending on how long a specific request takes, the circles can be big or small.
This makes it extremely easy to see all the requests and find ways to improve your page speed by reducing the number of your requests.
The tool also allows you to download the results as a CSV file so that you can dive deep into the numbers.
All told, ALL of these tools are valuable for different reasons – meaning that you should likely employ multiple options just to keep things moving as they should be. But once you have solutions like these on your site, page speed isn’t something you’ll have to worry about any longer.


